Explore is more than pretty dashboards. It’s a comprehensive customer analytics toolkit that helps you measure and optimize every interaction a customer has with your business. It integrates seamlessly with every Zendesk channel, so your team always has the data to make better decisions.
Interactive dashboards for every channel
Let best practices lead the way
We’ve done the heavy lifting and pre-calculated common customer service metrics for you, so you can start measuring your customer data right away.
Act on real-time trends
Use live dashboards to keep an eye on key customer service metrics across teams and channels.
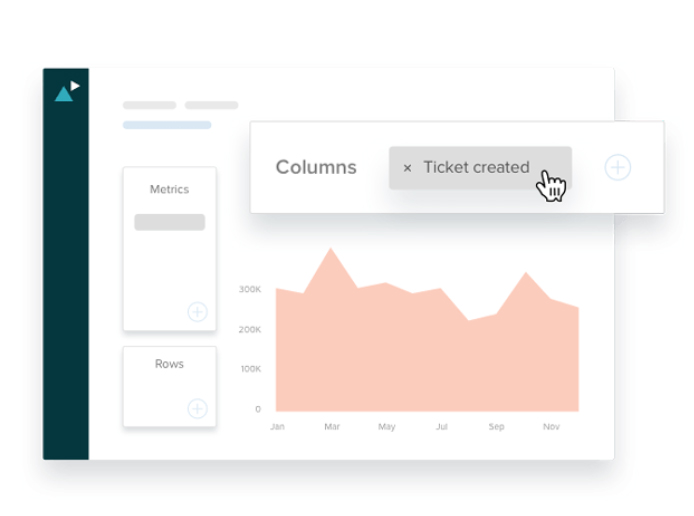
Slice and dice everything
Filter your data by team, date, or custom field to dial in on each part of your business.
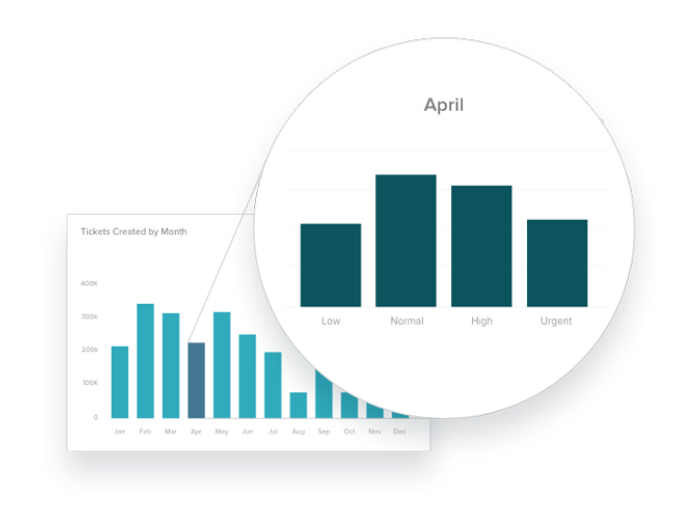
Drill down and Dig in
Break down trends in your customer data or take a look at granular ticket level details to see which underlying factors drive performance.
Export your finding
Download customer data in a variety of formats—CSV, Excel, PDF, or Image—to use as you see fit.
Customize reporting to fit your needs
Build custom chart and dashboards without writing a single line of code.
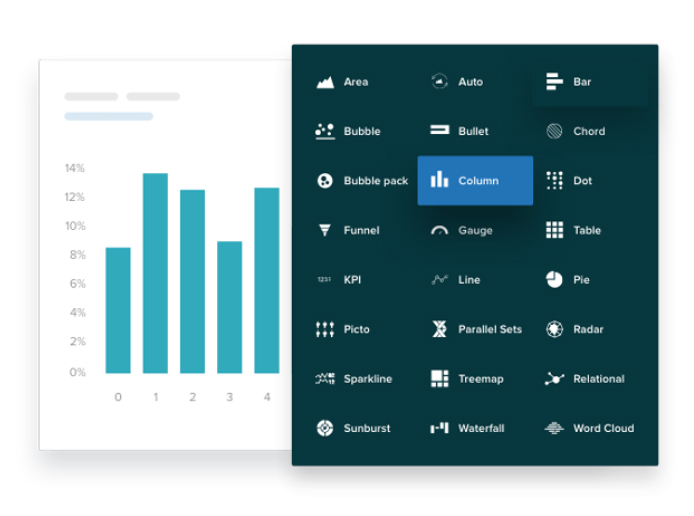
Choose from 20+ chart types to help you display data in better way. Explore has every visualization option you need.
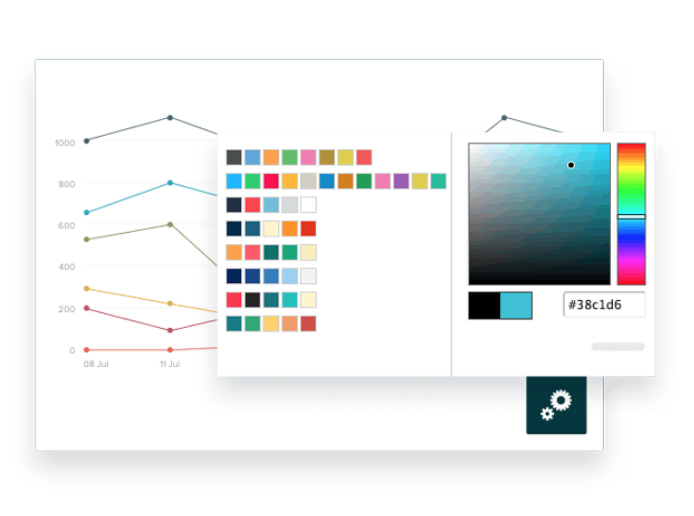
Tweak the formatting options of any chart to make your data easier to read and customize dashboards to match your brand.
Dive deep into your data with one-click drill-ins that help surface underlying trends and patterns.
Chart recommendations
Let Explore choose the best chart type for your data or build your own custom charts, all from one clean interface—without writing a single line of code.
Custom fields
Create metrics and attributes that align with your support objectives and track the data important to your team.
Forecast ahead
Get a better idea of your ticket volumes and response times to optimize planning and staffing efforts.
Control your results
Easily sort your data, apply patterns, or limit your findings to the top ten or bottom attributes to get a more granular view of your business.
Keep it tidy
Organize your analytics workspace by grouping your custom fields, toggling display formats, and categorizing most used queries as Favorites.
Share and collaborate with teammates
Dashboard viewer portal
One place for your entire team to view all the shared dashboards.
Share with your team
Publish live dashboards, schedule automated delivery, and share dashboards using public or password-protected links to make sure everyone is in the know.
Product-wide search
Search across all of your dashboards, queries, or data sources to find exactly what you’re looking for.
Role and permissions
Specify security permissions to control what users can see and do.
Secured attributes
Restrict the data displayed on dashboards to a specific group of agents.
Global availabilty
Store your Explore data wherever your Zendesk Support instance is hosted.
Miltilingual
Localized customer analytics enable teams to scale their customer support efforts globally.